Every skier knows the hit we’re talking about. The one at the bottom of the run your knees file a complaint about. The patch of ice under the chop, the compression you didn’t see, the landing that arrives a half-second early. We started calling them body shocks, and this winter we decided to stop describing them and start measuring them.
So we bolted a motion sensor to the ski. Then we bolted an identical one to the ShredShox platform, directly under the boot. Whatever the snow throws at the ski, the difference between those two sensors is — by simple physics — what the suspension absorbed before it reached you.
7 paired sessions · ~150 minutes of matched recording · 291 hard hits over 2 g · Colorado, Dec 2024 – Jan 2025
How we measured it
Two identical sensors, one above the suspension and one below it, logging together on the same runs. No lab, no shaker table, no modelling — just what actually happened on the hill, recorded at both ends of the platform.

Then we went skiing. Seven sessions across Colorado, December through January. Powder days, chop, groomers going bulletproof in the afternoon.
The harder the hit, the more it takes
On sustained vibration — the constant chatter that wears you down run after run — the platform cut what reached the boot by a median of 26 percent, session after session, every session.
But the real story showed up when we sorted the hits by how violent they were.
2–4 g · 225 events
over 4 g · 66 events
over 6 g · 34 events

Read that again. The attenuation doesn’t fade when things get ugly — it escalates. The worst moment of your day is exactly when the suspension works hardest.
The eight biggest hits we recorded
Every one of these is a single moment on a single run, timestamped in a raw sensor file. Left column is what hit the ski. Next is what arrived at the boot.
| Session | At the ski | At the boot | Cut | Edge |
|---|---|---|---|---|
| 12/06 11:26 | 13.1 g | 2.1 g | −84% | 19° |
| 12/28 13:01 | 12.6 g | 0.8 g | −94% | 7° |
| 01/21 12:11 | 12.3 g | 1.9 g | −85% | 7° |
| 12/06 11:26 | 11.6 g | 0.5 g | −96% | 11° |
| 12/28 11:00 | 11.3 g | 0.2 g | −98% | 1° |
| 01/03 09:53 | 11.0 g | 1.6 g | −86% | 26° |
| 12/28 13:01 | 10.7 g | 0.5 g | −95% | 23° |
| 12/28 13:01 | 10.4 g | 5.6 g | −46% | 27° |
The biggest one — 12.6 g at the ski, 0.8 g at the boot — happened on a Tuesday in December at 13:01. Here is that exact moment, drawn straight from the file.


And it is exactly the moment a reviewer described after an unplanned hit last season:
“Had I been on my regular ski setup, I would have felt my brain rattle inside my skull. But the ShredShox damped that impact enough that I was unphased.”
GearJunkie · Product review
That is a body shock, described from the inside. The number beside it is the same event, described by an accelerometer.
Every session. Not the best one.
It would be easy to publish the one run that looked spectacular. Here is all of it instead — every paired session we recorded. The platform read lower in all seven.

It doesn’t quit when you’re on edge
Suspension that only works going straight would be a gimmick. So we used the sensors’ orientation data to check what happens when the ski is tipped over.
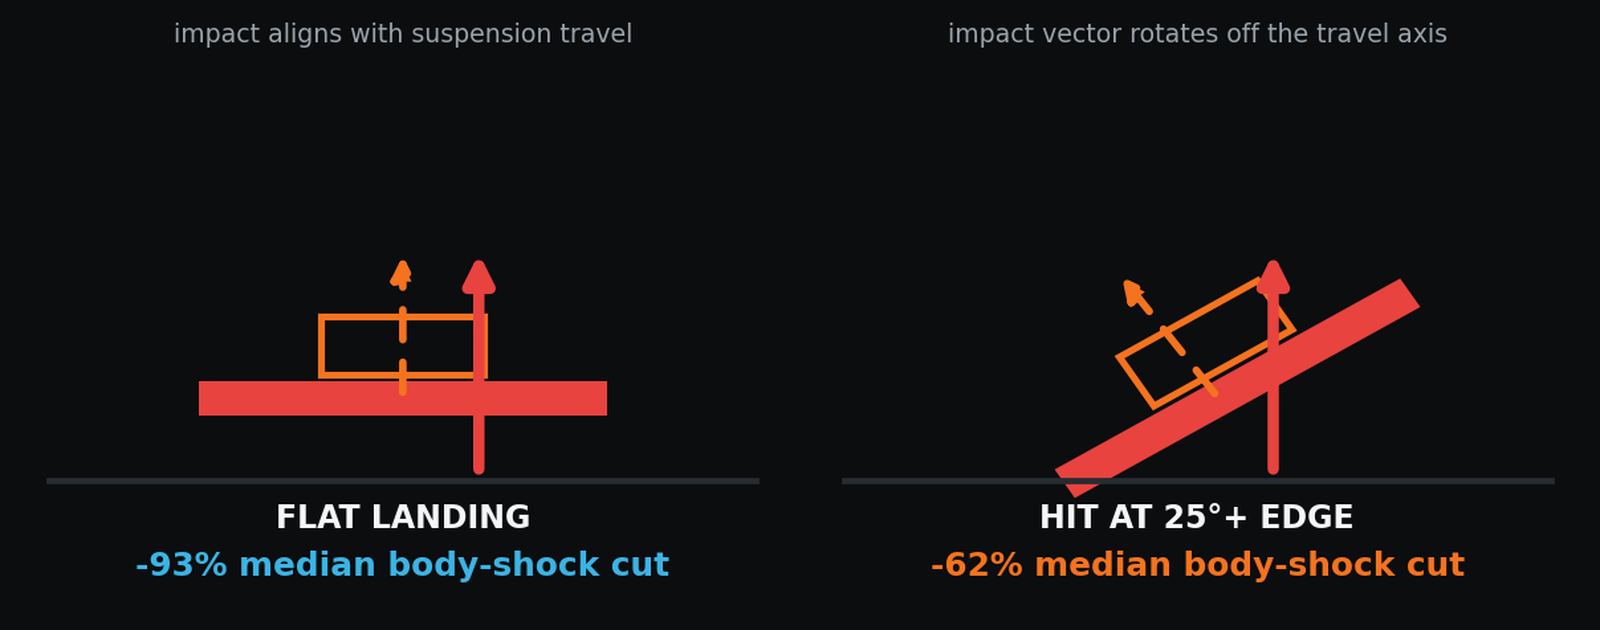
Damping held across every edge angle we measured — and it was actually strongest in the carving range, 10 to 25 degrees, right where edge grip is earned or lost. The rotational wobble reaching the boot while edged was about a third lower than what the ski was doing underneath.

Riders got there first. Every one of these came off a demo day, long before we ran the numbers:
“You find the edge before you realize it.”
Breckenridge demo
“I trusted the edge. I trusted it would hold.”
Breckenridge demo
“It holds a line better than ever before.”
Breckenridge demo
“You could hit a patch of ice and then it would just chill.”
Loveland first chair demo
“On ice, you don’t slide as much, feels good.”
Loveland first chair demo
“As soon as I started picking up speed — the way that it carved and holds, and through the bumps.”
Loveland first chair demo
Being straight with you is the whole point of publishing this. Single big impacts taken at extreme edge angle are cut less than impacts landed flat — 62 percent versus 93 percent. Still strong. But our engineers now have that number taped to the wall, and the next platform revision gets scored against it.

More runs for the same cost
Here’s the number your legs care about. Vibration exposure adds up over a day the way sun exposure does — dose over time. At the levels we measured, a skier on the platform accumulates the same vibration energy dose in 1.8 times the ride time.
Call it nine runs for the fatigue cost of five. More good runs in a day. More good years on snow.

Which is, almost word for word, what riders say when they come off the hill at the end of a long day:
“You don’t feel it on the knees at all.”
Loveland first chair demo
“It’s really nice on the bumps, and on the ice I felt a lot less fatigue in the legs.”
Loveland first chair demo
“26,000 feet today and it just kept getting better. My knees are happy!”
Breckenridge, first day on the mountain
“Floating all day top to bottom.”
Loveland first chair demo
What riders felt, and what we measured
Testimonials and telemetry are usually two separate marketing exercises. In our case they were collected months apart, by different people, with no knowledge of each other — and they landed in the same place.
Why you can trust these numbers
Because we did this twice without meaning to. Back in November, a one-run snapshot at Loveland measured a 34 percent reduction in hard vibrations and impacts. This winter’s full study — different mountains, different sensors, months apart, independently analyzed — found 36 percent.
Different data. Same answer.
That’s what a real effect looks like.
We never quote a reduction bigger than 100 percent. We never quote numbers where there’s nothing to measure. Every figure in this post traces back to raw sensor logs through a documented, repeatable analysis. The full research writeup — methods, figures, limitations and all — is available if you want to go deep. Ask us. We love that.
“Even in a single day, it had damped my skepticism.”
GearJunkie · Product review
What’s next
Higher-speed sensors that can see the full frequency range of ski chatter. Speed data paired with every run. More riders, more snow, more hits for the ledger. The dataset grows every test day, and we’ll keep publishing what it says — including the parts that give our engineers homework.
The mountain is going to keep hitting. We’re going to keep measuring exactly how much of it you never feel.
Tame the terrain.
Data collected by Next Level Platforms using WitMotion WT901 sensors mounted to the ski and to the ShredShox platform. Seven paired field sessions, ~150 minutes of matched recording, Colorado, Dec 2024 – Jan 2025. Figures are medians across measured events; analysis reproducible from raw logs. Rider quotes from Loveland First Chair demo (Nov 2024), Breckenridge on-snow review (Dec 2024), and a published GearJunkie product review.